Flood Mapping Explained
What is flood mapping and how do you use it?
![[object Object] [object Object]](https://www.royalhaskoningdhv.com/-/media/images/employees-profile-pics/s/smith-katie/smith-katie.png?h=500&iar=0&w=500&hash=FF840C2F8BCF9E82E780BE70B95134EF)
But what is flood mapping? What do you get from it? And how do you integrate it into your planning?
This article answers frequently asked questions about this important tool in the climate resilience arsenal:
-
What is flood mapping?
-
How do you use flood mapping to understand climate change risks?
- What climate models does flood mapping use?
- What climate scenarios should you map?
- What flood-related hazards should you map?
- What is hydrological modelling and how is it different to flood mapping?
- What data outputs do you get from flood mapping?
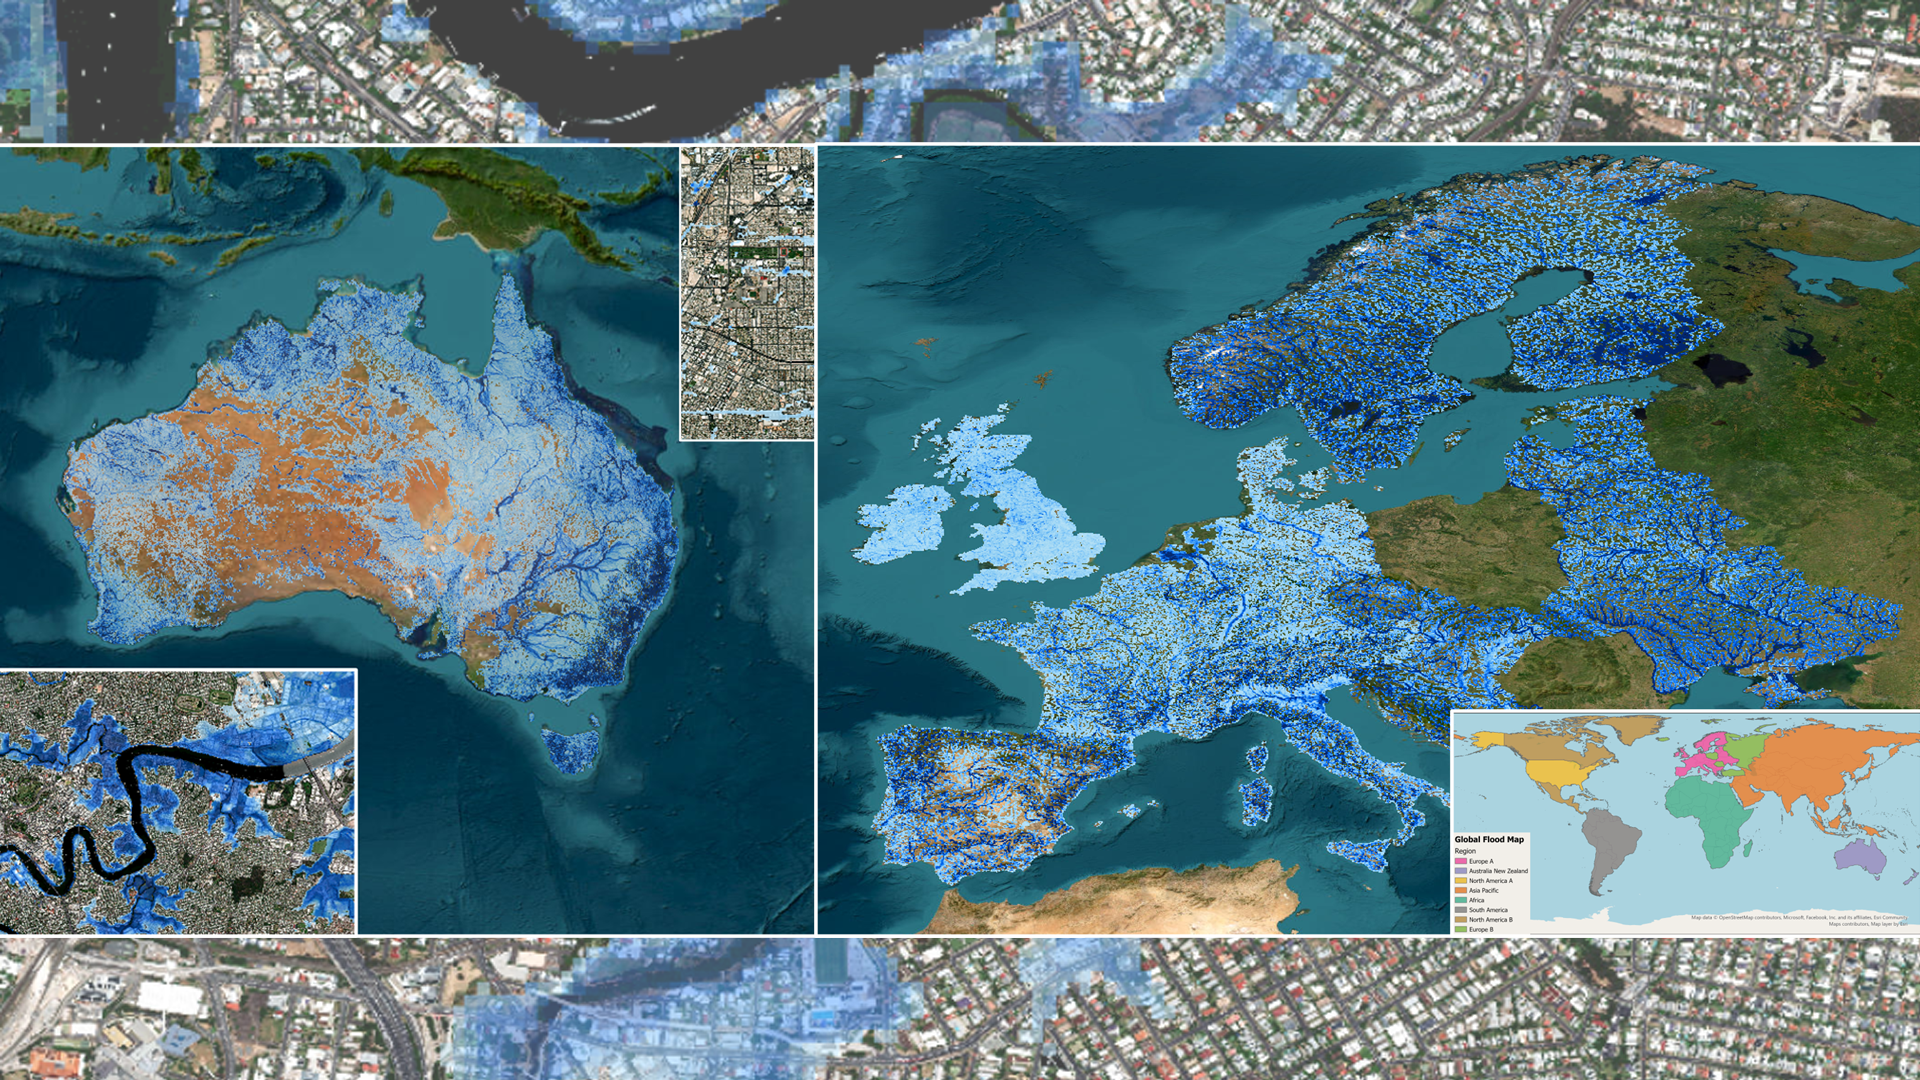
What is flood mapping?
Flood mapping is an exercise used to identify areas at risk of flooding. Flood maps show the depth and extent of flooding at any given location for specific return periods (which indicate the frequency of different magnitude events). This is important because it shows how flood risk changes under various climate change scenarios, meaning you get a ‘crystal ball’ to see how specific locations will be affected in future.
Organisations use flood mapping for a variety of risk mitigation and business resilience planning purposes, whether it’s to make more informed investment decisions, plan maintenance and upgrades, or ensure they have robust operations and supply chains.
Here are a few examples:
- Insurance and reinsurance – understanding and pricing risk appropriately, avoiding adverse claims and managing over-aggregation of risks (read more here)
- Financial services – getting clarity on flood risk for individual properties and assets, so they can mitigate against devaluation and prevent reduction in capital (read more here)
- Real estate – understanding future flood risk to sites and properties, meaning architects, developers and investors can make more informed decisions and conveyancers and surveyors can more easily comply with regulatory guidance (read more here)
- Utilities and telecoms – identifying assets most at risk from flooding so they can take preventative action that would affect uptime (read more on utilities here and telecoms here)
- Energy and industry – understanding where assets and operations are at risk of flooding so they can protect operations and supply chains (read more on energy here and industry/infrastructure here).
How do you use flood mapping to understand climate change risks?
When we consider the various effects of climate change (from drought and heatwaves to wildfires and storms), flooding is one of the most common. Even areas that currently have desert-like conditions or extremely low rainfall can be prone to flash flooding. Therefore, understanding flood risk now and in the future is essential when it comes to making investments – whether it’s a mortgage lender underwriting a property, a property developer investing in an office building, a manufacturer building a factory or a utility upgrading its network.At the same time, flooding is one of the hardest climate hazards to predict because it is so dynamic. Wind and other atmospheric hazards can generally be projected using statistical analysis. Flood requires more complex modelling that incorporates a wide range of dynamic parameters covering topography, metrology, infiltration capacity and more. As a result, even organisations with experienced in-house risk analysis teams tend to bring in external flood mapping solutions.
What climate models does flood mapping use?
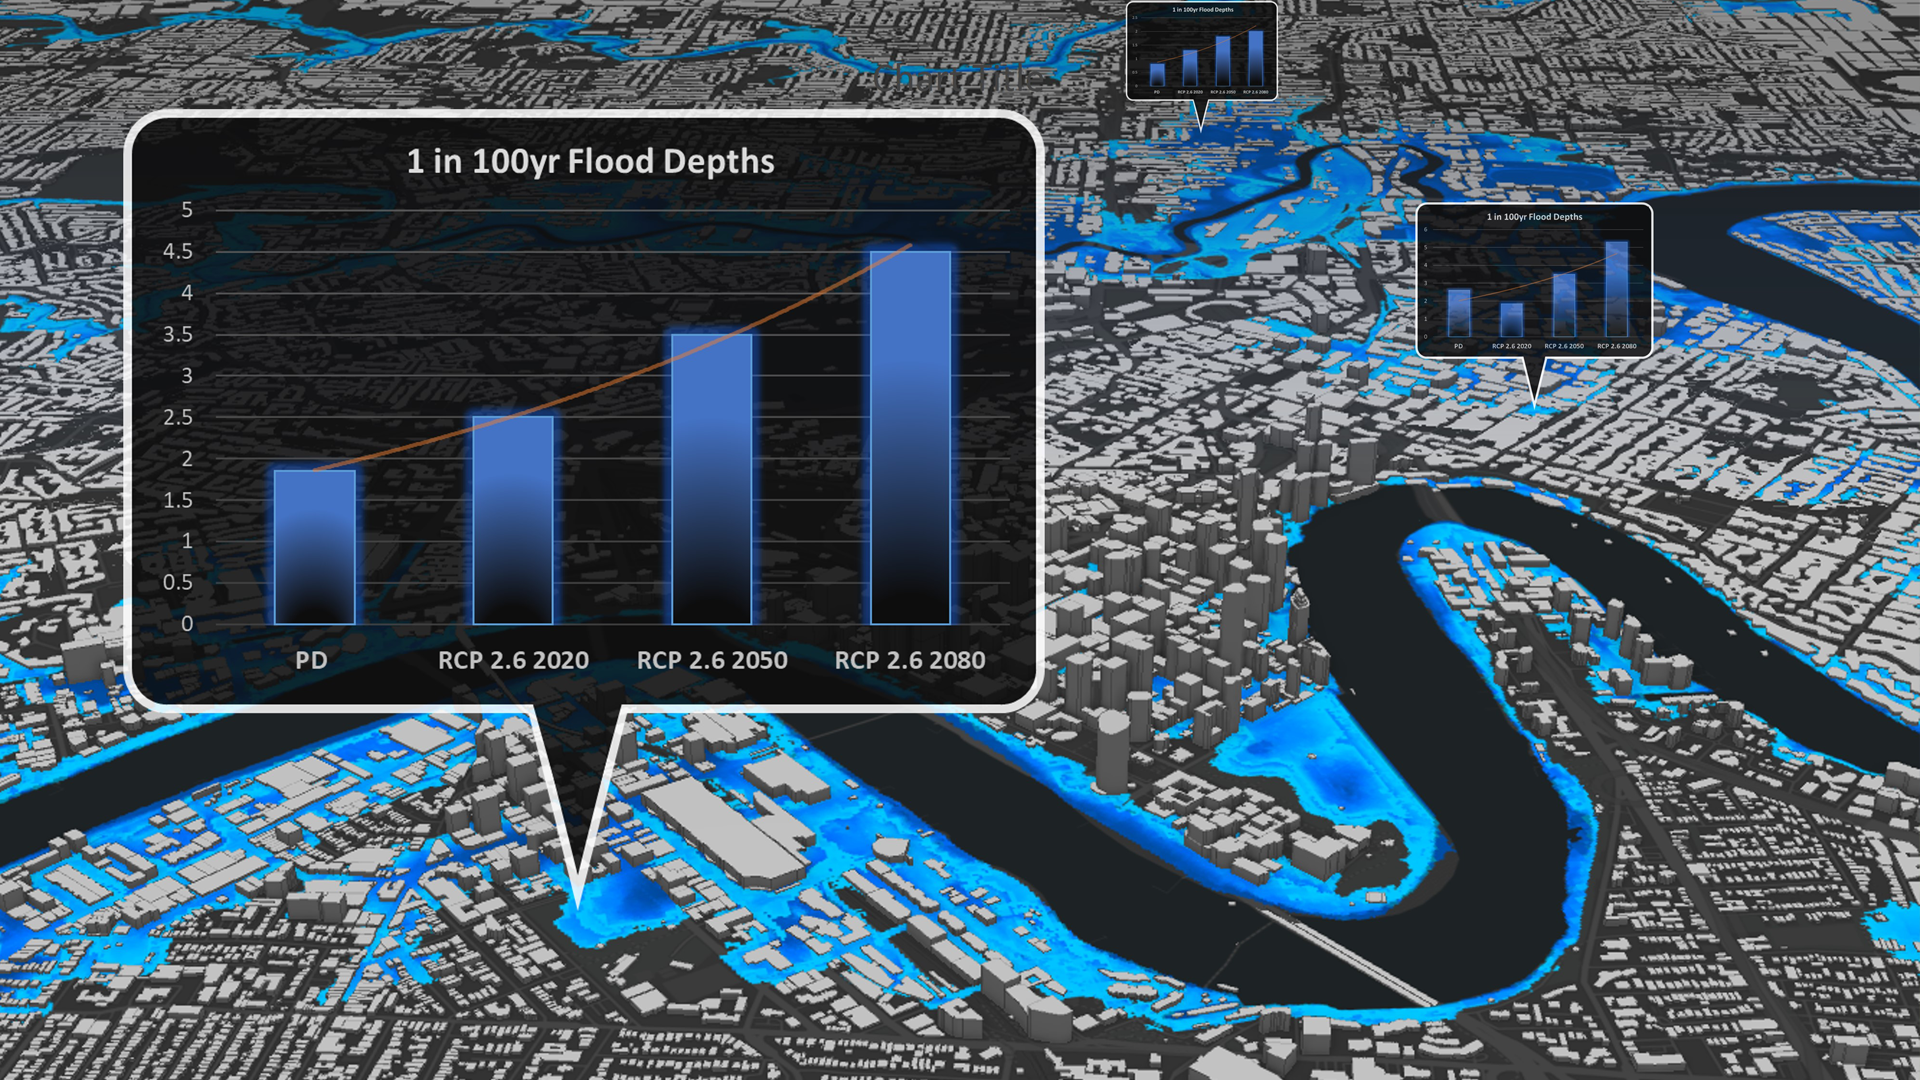
Best practice is to use a flood map based on Coupled Model Intercomparison Project Phase 6 (CMIP6), which represents the latest available climate science. CMIP is a project of the World Climate Research Programme’s Working Group of Coupled Modelling. It aims to advance understanding of climate change using a multi-model framework incorporating experiments from numerous international modelling teams.Flood mapping takes CMIP’s outputs and uses them to project present-day flood data into the future. To give you an idea, Twinn Global Flood Map Climate can give flood risk insight for any given year from 2020 to 2100 under any RCP scenario. For example, you can see the flood depth and extent for a 1-in-100-year flood in 2080 under the RCP8.5 / SSP5-8.5 pathway.
Depending on what your organisation is looking to gain from flood mapping, having access to high-resolution local data may be important, too. In these cases, you want to go beyond CMIP and look for a product with layers built using more detailed national information. The UK Climate Projections 2018 (UKCP18) and Australia’s Coordinated Regional Climate Downscaling Experiment (CORDEX-Australasia) are good examples.
One more note on this…An important feature to look for in a flood mapping product is its ability to update quickly as new climate science becomes available.
What climate scenarios should you map?
Again, that depends on what you’re looking to achieve with flood mapping (Twinn Global Flood Map Climate can give you data to 2100 for any RCP scenario).
However, to give you a benchmark, the most popular are:
- Climate scenarios – RCP 2.6, 4.5 and 8.5
- Time points – present day, 2030, 2050 and 2080
Your mapping should also cover a range of return periods, which indicate the frequency of different magnitude events. Example return periods include a 1-in-20-year flood event (5% annual chance) to a 1-in-10,000-year one (0.01% annual chance).
What flood-related hazards should you map?
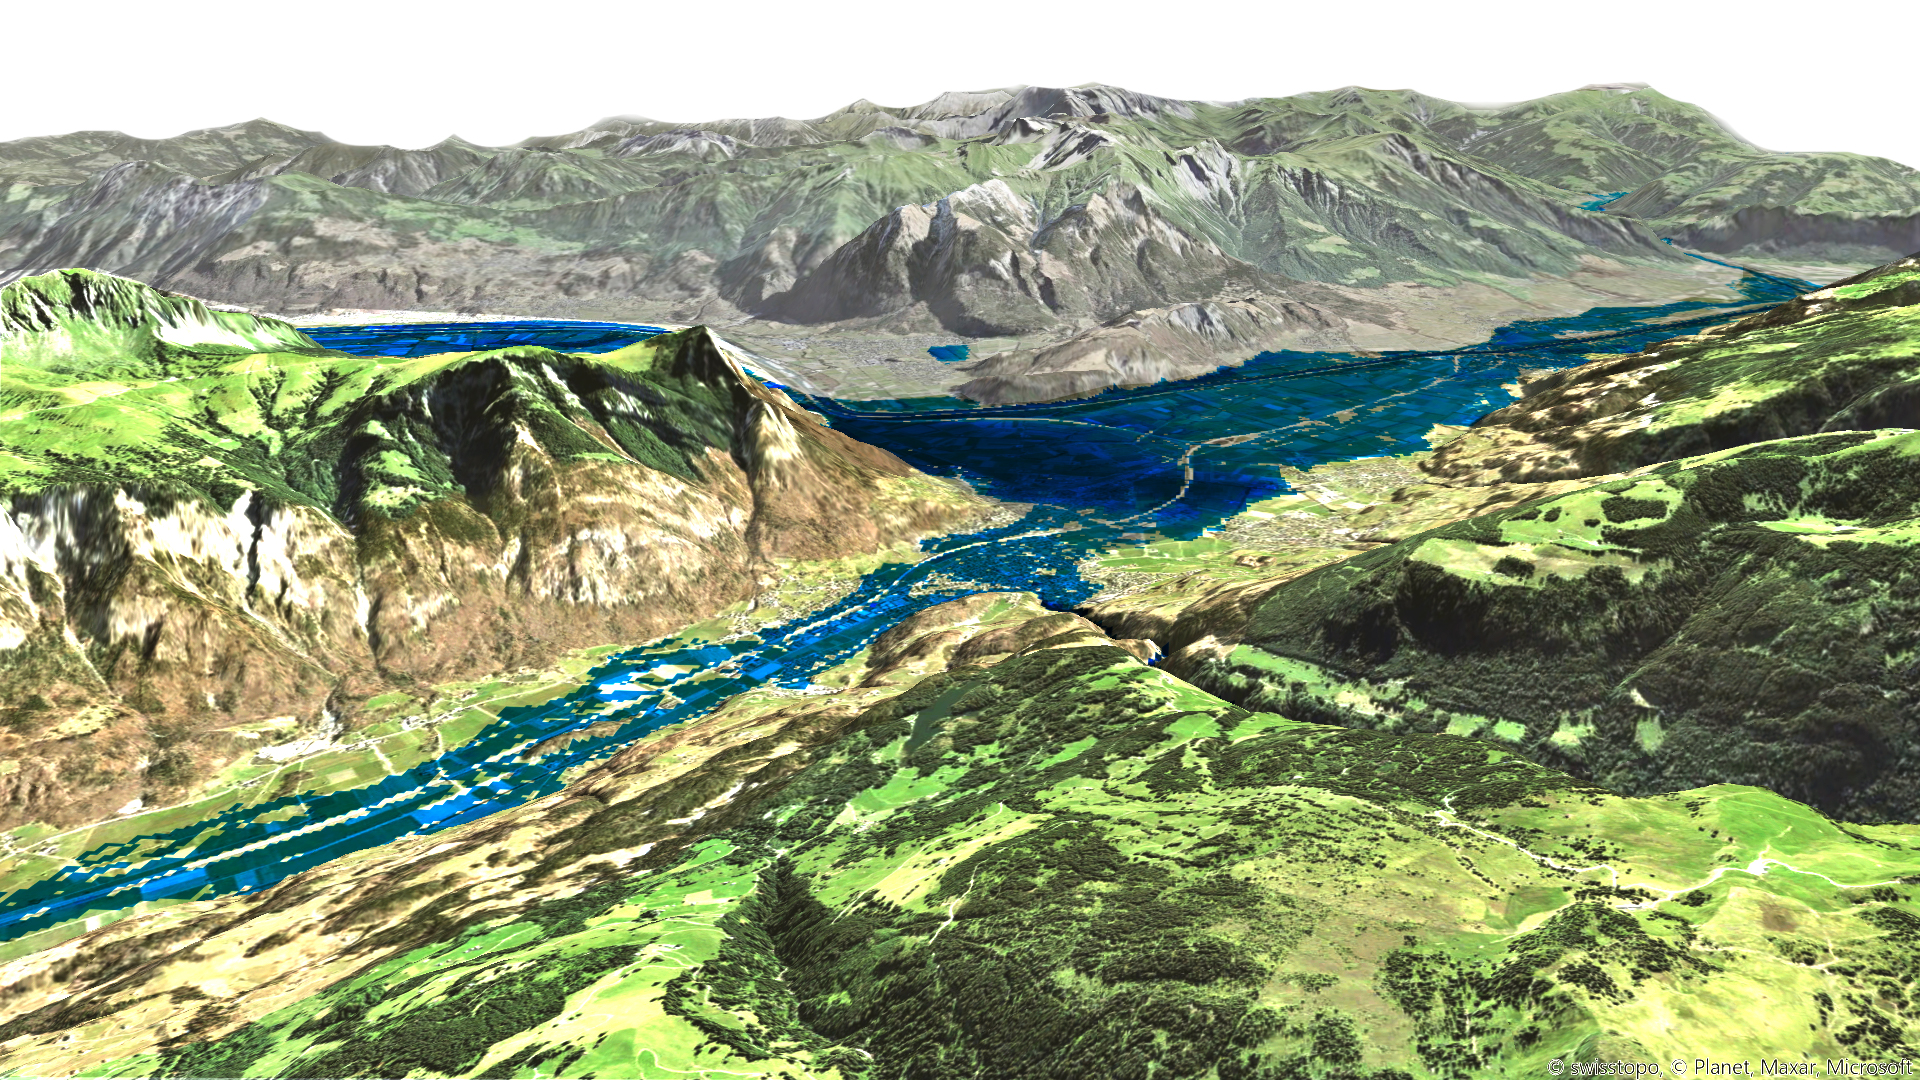
Flood mapping should cover the 3 types of flooding:
- Fluvial (river)
- Pluvial (surface water)
- Tidal (coastal)
What is hydrological modelling and how is it different to flood mapping?
Hydrological modelling is separate to flood mapping – essentially, it’s an earlier stage in the process that enables flood mapping.
Hydrological modelling is performed to generate input peak flows, rainfall intensities and extreme storm surge elevations for a range of return periods for fluvial, pluvial and tidal models, respectively.
- Hydrological modelling on its own doesn’t enable you to understand flood risk.
- Data from hydrological modelling feeds into hydraulic modelling, which are the flood simulations
- Flood simulations tell you the extent and depth of flooding, which is the hazard information that goes into the flood map and informs risk scores for a given location
Flood maps can draw on various approaches to hydrological modelling, such as rainfall runoff, statistical and probabilistic methods (which we either perform ourselves or obtain from third-party organisations). For example, we source UK rainfall and river flood frequency estimations from the Centre for Ecology & Hydrology (CEH).


What data outputs do you get from flood mapping?
Again, it depends on what you’re trying to achieve with flood mapping, because you can extract and visualise the data in many ways. Financial services and insurance companies, for instance, need granular flood data. Often, utility, energy and industrial companies are focused on higher-level risk scores for specific areas.Twinn Global Flood Map Climate caters for the entire spectrum.
If you want to translate that depth and extent data into flood risk scores, you can overlap address and vulnerability data. This gives you an at-a-glance view of flood risk down to individual property level, anywhere in the world.
